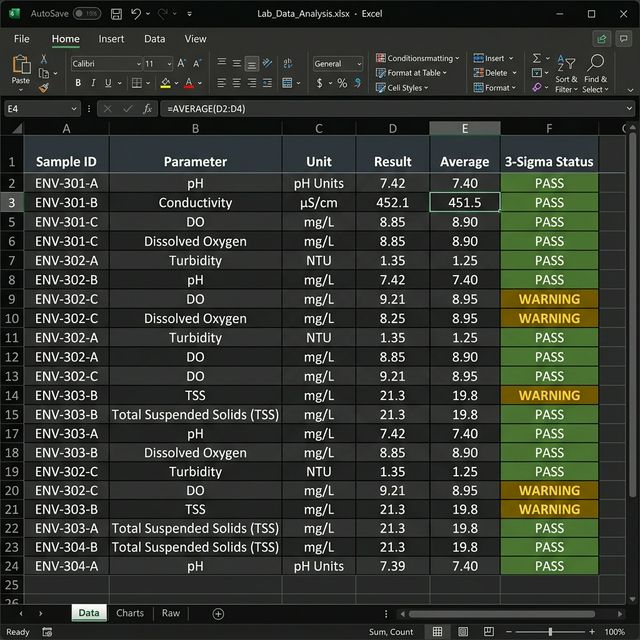
Most teams spend hours preparing data before they can even start analysing it. We turn fragmented lab results into a clean, structured dataset in 24h.
Most R&D teams lose weeks every year simply trying to make their data talk to itself.
Results trapped in scattered PDFs, CSVs, and non-standardized Excel sheets.
Hours spent aligning headers and units just to perform a basic comparison.
Statistical anomalies go unnoticed because there's no baseline to compare against.
R&D slows down because the data isn't "decision-ready" when the Director needs it.
Stop managing files. Start managing insights.
Stop manual Excel entry. We map your disparate laboratory headers into a single, standardised historical dataset.
Automated 3-Sigma monitoring. Benchmarks every new result against your entire historical dataset to catch drift instantly.
Side-by-side sample correlation. Visualize performance across multiple batches, suppliers, and timeframes on one axis.
Simple, secure, and built for technical leadership.
Drop your lab reports (PDF, CSV, Excel) into your private, encrypted Secure Zone.
We perform schema mapping, unit alignment, and a 3-Sigma statistical audit across your history.
You get a structured dataset + insights. Clean, ready to use, and formatted for comparison.
From messy PDFs to decision-ready data. Here is exactly what we deliver.
Sample: Batch-A Prop: density (d20) Val: 0.892 g/cm3 --- Sample: B-02 Density @ 20C: 895 kg/m3
We align different units (e.g. g/cm³ and kg/m³) into one standard protocol.
Disparate lab headers are mapped into your custom master schema.
Baseline every batch against your multi-year historical average.
Delivered in clean Excel or CSV. Straight to your R&D report.
Typical scope: 10 lab reports per audit | Turnaround: < 24 hours | First Audit: Free
Designed to validate fit before any commitment.